{Python}
import numpy as np
import matplotlib.pyplot as plt
from skimage import data, color, feature
image = color.rgb2gray(data.astronaut())
edges = feature.canny(image, sigma=2)
plt.figure(figsize=(6,6))
plt.imshow(edges, cmap='coolwarm')
plt.axis('off')
plt.show()
import numpy as np
import matplotlib.pyplot as plt
from skimage import data, color, feature
image = color.rgb2gray(data.astronaut())
edges = feature.canny(image, sigma=2)
plt.figure(figsize=(6,6))
plt.imshow(edges, cmap='coolwarm')
plt.axis('off')
plt.show()
{Python}
import numpy as np
import matplotlib.pyplot as plt
size = 500
num_triangles = 12
angles = np.linspace(0, 2*np.pi, num_triangles, endpoint=False)
plt.figure(figsize=(8,8))
for i in range(num_triangles):
x = [0, np.cos(angles[i]), np.cos(angles[i] + np.pi/3), 0]
y = [0, np.sin(angles[i]), np.sin(angles[i] + np.pi/3), 0]
plt.fill(x, y, color=plt.cm.viridis(i / num_triangles), alpha=0.8)
plt.axis("equal")
plt.axis("off")
plt.show()
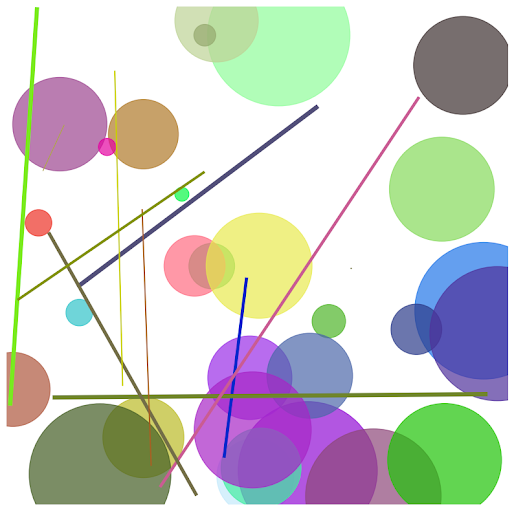
{Python}
import numpy as np
import matplotlib.pyplot as plt
fig, ax = plt.subplots(figsize=(6, 6))
ax.set_facecolor('black')
for _ in range(30):
x, y = np.random.rand(2)
size = np.random.rand() * 0.15
color = np.random.rand(3,)
circle = plt.Circle((x, y), size, color=color, alpha=0.7)
ax.add_patch(circle)
for _ in range(10):
x1, y1, x2, y2 = np.random.rand(4)
plt.plot([x1, x2], [y1, y2], color=np.random.rand(3,), linewidth=np.random.rand()*5)
plt.xlim(0, 1)
plt.ylim(0, 1)
plt.axis('off')
plt.show()
{R}
library(ggplot2)
library(RColorBrewer)
set.seed(345)
ngroup=30
names=paste("G_",seq(1,ngroup),sep="")
DAT=data.frame()
for(i in seq(1:30)){
data=data.frame( matrix(0,ngroup,3))
data[,1]=i
data[,2]=sample(names, nrow(data))
data[,3]=prop.table(sample( c(rep(0,100),c(1:ngroup)),nrow(data)))
DAT=rbind(DAT,data)
}
colnames(DAT)=c("Year","Group","Value")
DAT=DAT[order( DAT$Year, DAT$Group),]
coul = brewer.pal(12, "Paired")
coul = colorRampPalette(coul)(ngroup)
coul=coul[sample(c(1:length(coul)),size=length(coul))]
ggplot(DAT, aes(x=Year, y=Value, fill=Group )) +
geom_area(alpha=1 )+
theme_bw() +
scale_fill_manual(values = coul)+
theme(
text = element_blank(),
line = element_blank(),
title = element_blank(),
legend.position="none",
panel.border = element_blank(),
panel.background = element_blank())


No hay comentarios:
Publicar un comentario